TP RSITP RSI - Integrated Trend, Momentum, and Volatility Analyzer
The TP RSI indicator is an innovative 3-in-1 technical analysis tool that combines RSI, Bollinger Bands, and an EMA ribbon to provide traders with a comprehensive view of trend, momentum, and volatility in a single, easy-to-interpret visual display.
Why This Combination? This mashup addresses three critical aspects of market analysis simultaneously:
Trend identification and strength (EMA ribbon)
Momentum measurement (RSI)
Volatility assessment (Bollinger Bands)
By integrating these components, traders can make more informed decisions based on multiple factors without switching between different indicators.
How Components Work Together:
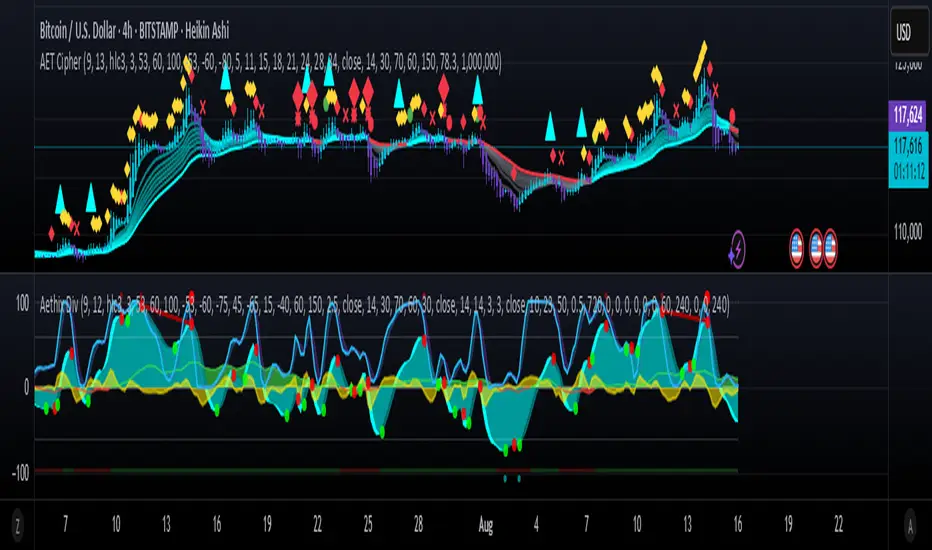
1. EMA Ribbon (Trend):
10 EMAs form 5 color-coded bands
Blue: Uptrend, Red: Downtrend
Provides a nuanced view of trend strength and potential reversals
2. RSI (Momentum):
Color-coded for quick interpretation
Blue: Upward momentum, Red: Downward momentum, White: Neutral
Position relative to the ribbon offers additional insight
3. Bollinger Bands (Volatility):
Applied to RSI for dynamic overbought/oversold levels
Narrow bands indicate low volatility, suggesting potential breakouts
Unique Aspects and Originality:
Synergistic visual cues: Color coordination between ribbon and RSI
Multi-factor confirmation: Requires alignment of trend, momentum, and volatility for strong signals
Volatility-adjusted momentum: RSI interpreted within the context of Bollinger Bands
How these components work together:
Buy Signal: Blue ribbon with blue RSI outside the ribbon.
Sell Signal: Red ribbon with red RSI outside the ribbon.
Neutral: White RSI or RSI inside the ribbon (not recommended for trading)
Increasing Momentum: RSI crossing above upper Bollinger Band (upward) or below lower Band (downward).
Trend Strength: RSI rejection by the ribbon, while all bands are colored along with the trend direction, identifies a strong trend.
Indicatore Pine Script®